Unlock the Full Potential of Your Omics Data
Expert biostatistics consulting for genomics, transcriptomics, proteomics, and multi-omics integration

Expert biostatistics consulting for genomics, transcriptomics, proteomics, and multi-omics integration
Transform complex omics datasets into actionable biological insights
Optimal experimental design, power calculations, and cost vs quality balance to ensure your study succeeds from the start.
Differential expression, isoform usage, spatial pattern detection, trajectory analysis, and pathway enrichment using state-of-the-art methods.
Seamless integration of transcriptomics, proteomics, metabolomics, and other omics layers with rigorous batch-effect correction.
Stunning, publication-ready figures: volcano plots, heatmaps, UMAP/t-SNE, spatial maps, pseudotime trajectories, and more.
Clear, narrative-driven interpretation that connects statistical findings to biological mechanisms and research questions.
Reproducible, automated analysis pipelines tailored to your specific data types and research needs.
University of Washington, Seattle
Biostatistics, genomics, and high-dimensional biomedical data
Developer of 20+ widely-used R packages (genetics, gplots, gmodels, gtools, gdata, and more)
Pfizer, Novartis, Boehringer Ingelheim, Medidata Solutions
University of Rochester, Yale University
Helping labs design smarter experiments and publish stronger results across academia and industry. 65+ LinkedIn endorsements
Example data visualizations
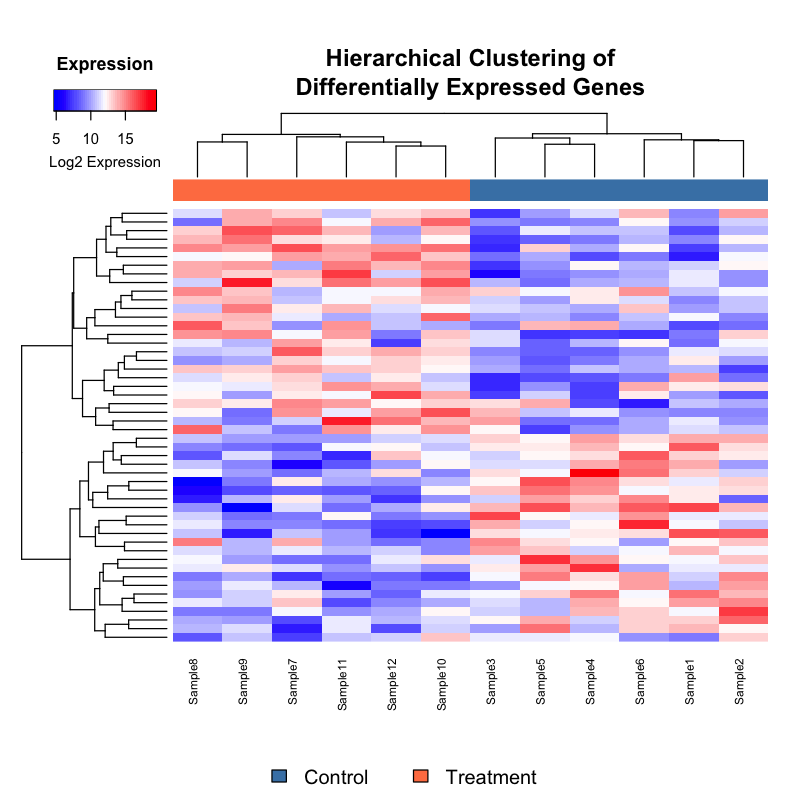
Hierarchical clustering of differential expression patterns across experimental conditions
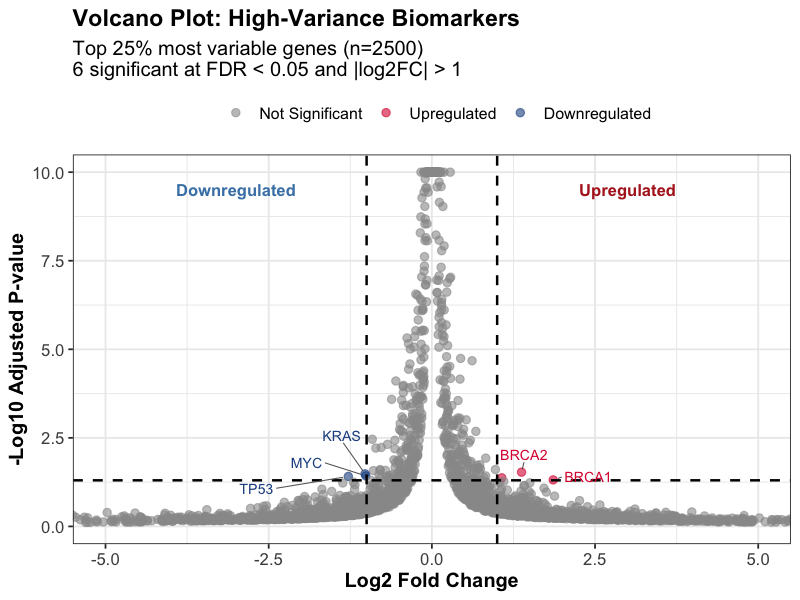
Statistical significance vs. fold-change visualization for identifying key biomarkers
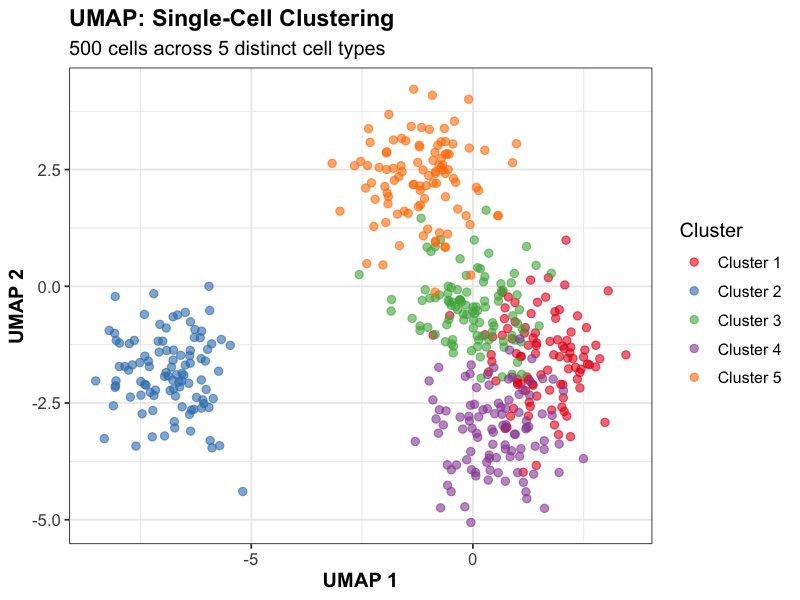
Dimensionality reduction revealing distinct cell populations and trajectories
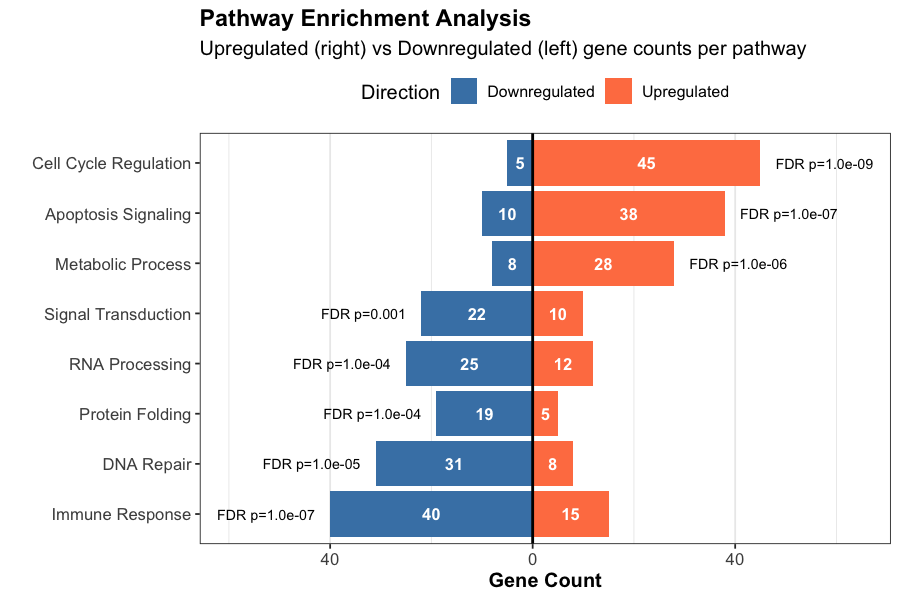
GO term and KEGG pathway analysis with statistical significance
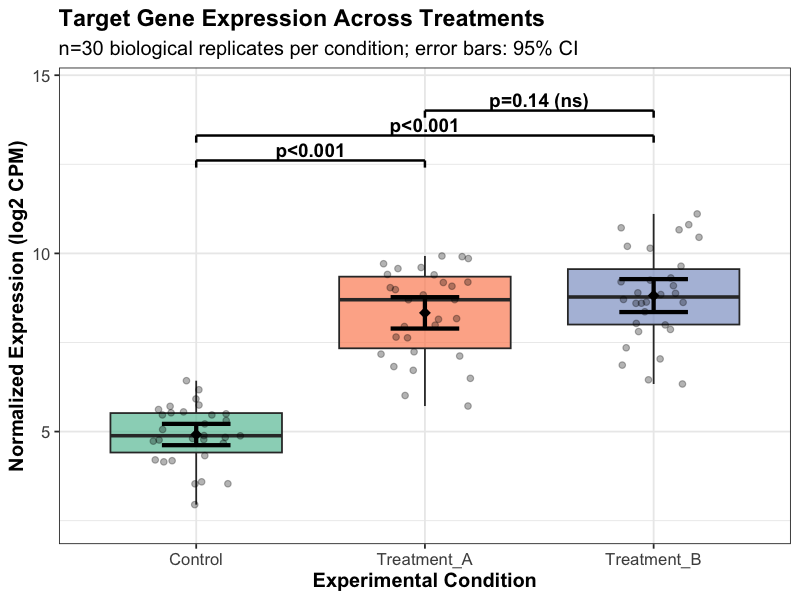
Target gene expression across experimental conditions with statistical testing
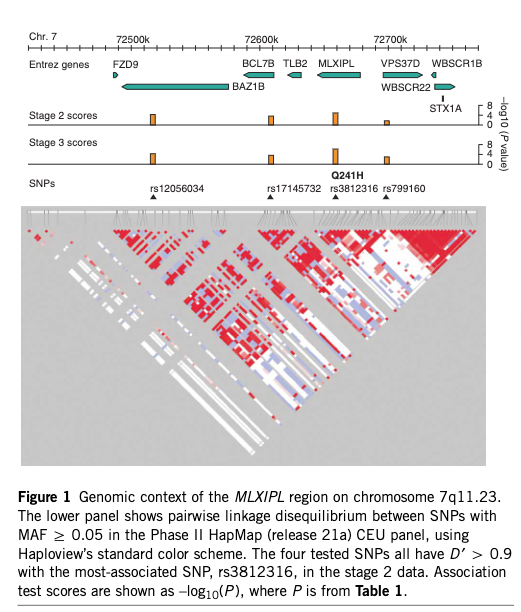
Manhattan plot showing association between MLXIPL variation and plasma triglycerides
From: Kooner JS, Chambers JC, Aguilar-Salinas CA, et al. (2008) "Genome-wide scan identifies variation in MLXIPL associated with plasma triglycerides." Nature Genetics 40:149-151. doi:10.1038/ng.2007.61
Visualizations: Includes both example analyses and figures from peer-reviewed publications demonstrating real-world applications of genomic data analysis. Each project receives custom visualizations tailored to your specific research questions and data types.
"Proven track record of helping labs design smarter experiments and publish stronger results"
Peer-reviewed publications and open-source contributions in biostatistics, genomics, and statistical computing
Free 30-minute consultation to discuss your research needs